It is quite usual to assess and represent the impact of a room by only plotting its frequency response at listening position (or multiple positions) …. And most of the correction systems or DIY methods are only using this information to generate filters.
This is a significant shortcut as any signal is only fully defined by the combination of its frequency (magnitude) and phase response. The same applies to the impulse response, the signal that characterize the room behavior.
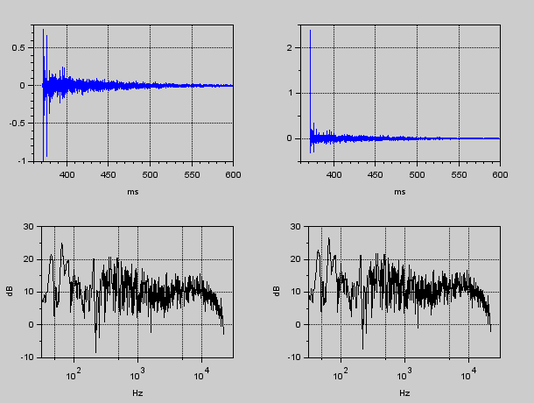
We can find an infinity of room impulse responses having the same frequency response, but all will have a different time domain representation. Here is an example showing 2 impulses responses with their time domain plot at the top and frequency response below
To demonstrate the importance of the time domain property of a room, it is very instructive to plot the envelope of the room response to a pure tone test signal (a sinusoidal signal with sharp onset and decay)
Using measurements from a customer room, I have selected four frequencies quite close in the bass range

It is easy to see the three main parts of the responses: the onset, the steady state and the decay after the source has stopped (at 0.4 s for this example) The source signals having the same amplitude, it is striking to see how much a room can impact the perceived level (20dB difference b/w 89 Hz et 100 Hz)
The steady part level is equivalent to what we get from a frequency response graph. It is obvious that making a correction using only this information is not sufficient as music is mostly made of transients and this example is showing that transient behavior can strongly differ from steady state: slow energy build up but quite high steady state level (112Hz), correct energy build up but low steady state level (89 Hz = anti resonance), etc...
The 89Hz case (black curve) is a good example of room issue that can be worsen when generating a correction w/o considering the time dimension: as the steady state level is low, this frequency will give a notch in the frequency response. An automatic correction algorithm or DIYer will be tempted to fill that dip with positive gain. Unfortunately, this will further boost the peak that appears when the source is stopped and blur the rhythm perception.
To have a better hint of what different timing means, you can listen to this audio clip with headphones. I have applied the impulse response of a customer’s room to an audio track to simulate the impact of the room. The simulation is alternating b/w the raw room response and the one with phase correction only: the frequency content is the same, only the timing is changed b/w the two versions.
Generating filters for a proper full range phase correction is a real challenge: you can correct a passive crossover phase shift with DIY methods, extending the phase correction to solve room issues requires specifics methods and tools. This is because time domain response can have strong spatial variability and correcting phase requires non causal filters that can generate excessive pre-response if not properly designed.
Don’t worry 😉 we master this for you and the smaller the measurement area, the more precise will be the phase correction.
Another alternative to improve timing perception is to use our Room Shaper plugin that work with different principles than “static” filters and is the “king” to correct room time domain issues.